Investigating Combline Filters for GSM Applications
Combline Filters
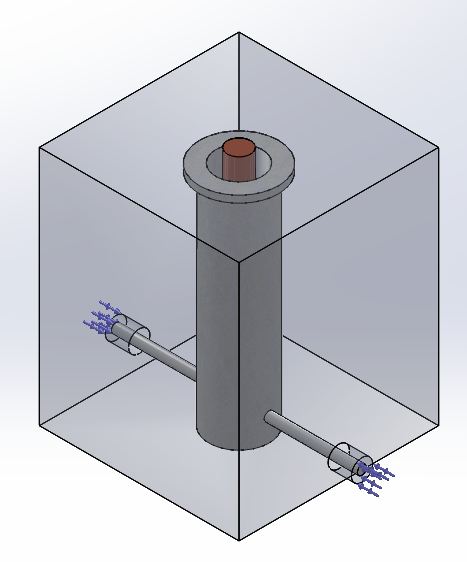
Combline filters, known for utilizing capacitively-loaded rods as resonators, offer a low-loss, durable, and compact solution. Typically, these rods are positioned between flat ground planes. This specific example focuses on a combline filter designed to operate around the 880 MHz frequency range, making it suitable for GSM applications. Simulations conducted with HFWorks demonstrate excellent concordance with actual measurements, underscoring the filter's effectiveness and reliability.
Figure 1 - the structure's 3D view in SolidWorks
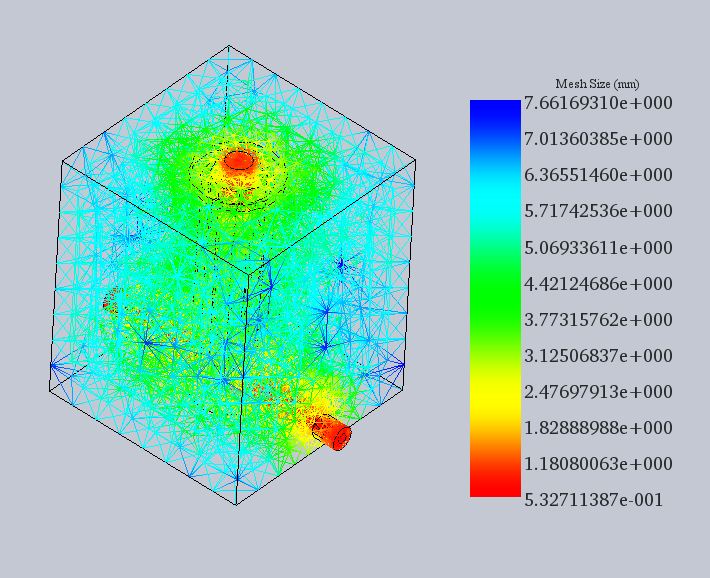
The mesh detail is enhanced around the ports to ensure precision in simulations. While HFWorks' default meshing intelligently adapts to the structure's dimensions for optimal configuration, users retain full control over the overall mesh size. They can also specify detailed meshing for sections deemed critical, tailoring the simulation to meet specific accuracy needs.
Figure 2 - Mesh of the structure
Simulation
In HFWorks simulations, the first step is setting up a study, here focusing on Scattering Parameters to ensure the filter achieves optimal return loss at 880 MHz with a 7 MHz bandwidth. A fast sweep frequency plan centered near 880 MHz is recommended for efficiency, though increasing the number of frequencies smooths the curves. Despite the time-saving benefits of fast sweep, a discrete frequency plan is preferred for its accuracy. The study offers extensive plotting options and analysis of electrical parameters like insertion and return losses.
Load/ Restraint
Assigning the two ports is straightforward: a port is typically assigned to a surface separating the ground from the signal conductors, essentially the dielectric layer. Both the rod and the filter's cylinder are treated as Perfect Electric Conductors (PEC), as are the surfaces of the air box, which are also designated with PEC boundary conditions.
Results
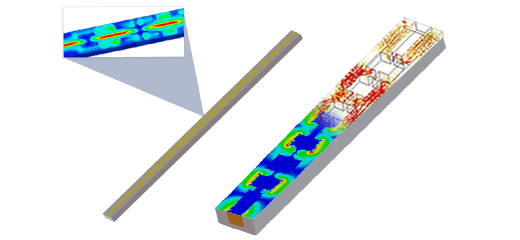
Once the model is meshed and analyzed, examining the electric field distribution becomes possible. The field can be animated to display both fringe patterns and vector directions. Utilizing section clipping views enables an in-depth examination of the field distribution within the model's internal components, offering detailed insights into its electromagnetic behavior.
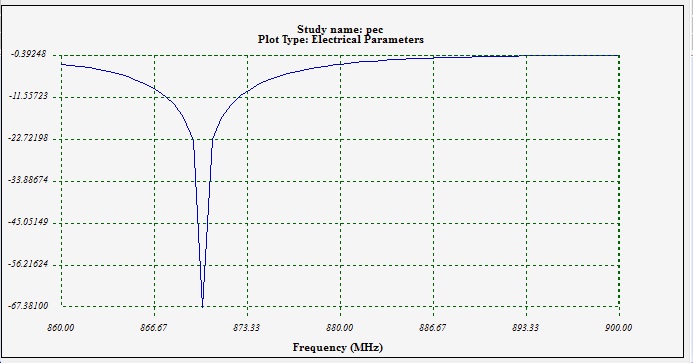
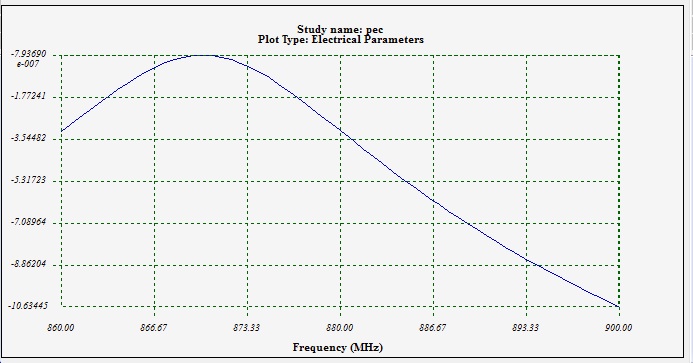
Figure 3 - Insertion (Bottom) and return (Top) losses
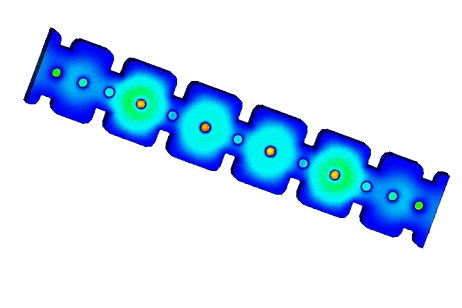
To view Scattering Parameters (SP), we access the Electrical Parameters results folder. Here, we have the option to select either a 2D plot or a Smith Chart for visualization. The curve can be explored using a marker, and additional predefined curves, such as a constant VSWR circle, can be plotted on the Smith Chart. This approach visualizes key metrics such as the filter's return loss and insertion loss effectively.
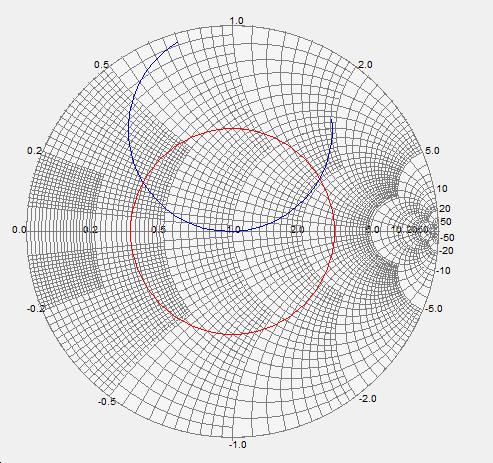
Figure 4 - S11 plot on a Smith Chart (880 MHz)
Conclusion
[1] SPower-Handling Capability for RF Filters Ming Yu IEEE microwave magazine October 2007


