Summary
The global spread of COVID-19, caused by the novel coronavirus, had a profound impact worldwide. Lockdowns, border closures, travel restrictions, and industrial shutdowns led to a significant decrease in greenhouse gas emissions from fossil fuel combustion. This period served as a remarkable demonstration of the potential air quality improvements achievable with widespread adoption of electric vehicles powered by clean energy. Computer-aided design (CAD) and simulation software offered by EMWorks play a crucial role in enhancing the efficiency and reliability of electric motors utilized in hybrid and electric vehicles. The blog concludes with a study on the electric motor used in Prius cars, showcasing the practical application of these technologies in the automotive industry.
Impact of COVID 19 on human behaviors
In the weeks following the initial report of the new coronavirus, later named COVID-19, in China in late December 2019, profound and rapid changes began to unfold both within China and across the globe. China swiftly implemented drastic measures, such as the closure of cities like Wuhan, the epicenter of the outbreak, and imposed travel restrictions and industrial shutdowns starting in mid-January 2020. These unprecedented actions aimed to contain the virus and prevent its spread throughout the country. On March 11, 2020, the World Health Organization (WHO) declared COVID-19 a global pandemic as the number of affected countries and fatalities surged exponentially. Consequently, numerous nations declared states of emergency. Once bustling metropolises like Paris, Milan, Berlin, Barcelona, Madrid, London, and New York became eerily deserted amidst the crisis.

Figure 1 - a) An empty area in front of the Eiffel Tower in Paris, as a strict lockdown came into effect in France to stop the spread of COVID-19, by Ludovic Marin/ AFP [1]
Impact of COVID 19 on Eco-system- Greenhouse gas emissions
With much of the global economy at a standstill and the majority of the world's population confined to their homes or working remotely, there has been a remarkable decline in emissions and a notable improvement in air quality worldwide. Satellite images captured in January and February 2020 over China, compared to the same period in 2019, reveal a significant reduction in nitrogen dioxide levels, as reported by the US space agency NASA. This decline is attributed to pandemic-related regulations enforced by the Chinese government, which subsequently led to similar reductions in greenhouse gas emissions globally.

Figure 2 - Nitrogen dioxide emission comparison between Jan and Feb 2020 above China sky [3]
*Nitrogen dioxide is used often as an urban pollution tracer since it is produced by burning fossil fuels. It can be easily measured by satellite.
New coronavirus is showing us how air quality could be improved if we were running electric vehicles
The COVID-19 crisis has offered a glimpse into a world with reduced greenhouse gas emissions, showcasing the potential impact of widespread electric vehicle adoption. Transportation alone contributes significantly to atmospheric CO2 levels, with the US accounting for 28% of total emissions. Similarly, the EU reports that 27% of its greenhouse gas emissions stem from the transport sector, highlighting a global trend. These statistics underscore the urgent need for sustainable solutions like electric vehicles to combat climate change.

Figure 3 - Gas emissions by sectors in USA [4]
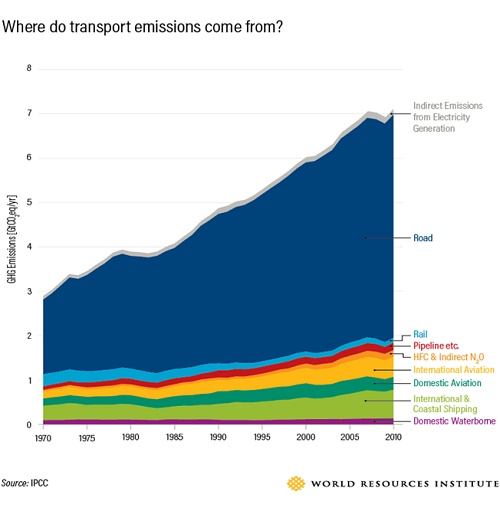
Figure 4 - Energy sources of transportation [6]
The decarbonization of the transport sector holds immense potential for reducing gas emissions and improving air quality. COVID-19 has highlighted the substantial decrease in air pollution achievable through widespread adoption of electric vehicles. With road transportation accounting for 70% of total emissions in the transport sector, transitioning to electric-powered vehicles is crucial. However, the temporary improvement in air quality seen during the pandemic will only endure if sustainable practices are maintained in the post-pandemic era.
What if?
As people stayed home during lockdowns, envisioning a world where electric vehicles (EVs) dominate transportation became palpable through satellite imagery captured amidst the pandemic. Yet, while the transport sector contributes only a quarter of CO2 emissions, EVs alone cannot mitigate the climate crisis.
International efforts to reduce emissions, coupled with renewable energy expansion, are vital. By curbing emissions, we can contain global warming and facilitate planetary recovery. Epidemiological studies revealing links between air pollution and respiratory illnesses underscore the urgent need for cleaner transportation. The COVID-19 crisis underscores the profound impact that widespread EV adoption could have on air quality. This should motivate increased investment in innovative, efficient, and affordable EVs. The electric vehicle market has grown rapidly in recent years, with sales reaching 5.6 million globally in 2019—a 64% increase from the previous year.
Computer CAD design and simulation in profit of car electrification
Battery and electric motor form the backbone of zero-emission vehicles, driving efforts by engineers and researchers to develop robust and efficient solutions. This blog delves into electric motor design and simulation, a crucial aspect of vehicle electrification.
At the initial stages of prototyping, CAD design models are essential for accurate calculations. EMWorks provides comprehensive electromagnetic simulation software, facilitating seamless motor design and analysis. EMWorks2D and EMS 3D cater to electromagnetic applications, including motors, generators, and sensors. MotorWizard offers automated electric motor CAD design and simulation through an intuitive interface. This integrated suite enables comprehensive analysis, yielding crucial data on magnetic fields, losses, performance, efficiency, mechanical behavior, and temperature.
The figures below depict 2D and 3D CAD models of the 2004 Prius electric motor, a pioneering hybrid vehicle. The motor, an Interior Permanent Magnet Synchronous Motor (IPMSM), boasts specifications outlined in Table 1.
-3D-CAD-model-b)-2D-CAD-model.jpg)
Figure 5 - 2004 Prius IPMSM, a) 3D CAD model, b) 2D CAD model
Table 1 - Specifications of the 2004 PRIUS IPMSM [10][11][12]
|
Specifications |
Values |
|
Rated Current |
230A RMS |
|
Rated Speed |
1200RPM |
|
Rated Torque |
400Nm |
|
Rated Power |
50kW |
|
Lamination Material |
M-19 |
The interior PM synchronous motor of the 2004 Prius features 48 slots and 8 poles nestled within the rotor laminations core. Both rotor and stator cores utilize laminated steel M-19, boasting a stacking factor of 0.94. This motor employs 3-phase distributed windings, single-layered with 9 turns per slot connected in series. Buried synchronous machines offer superior torque compared to surface-mounted machines, with torque stemming from permanent magnet and reluctance components. The V-shaped magnet housing enhances quadrature axis reactance, augmenting reluctance torque in sync with PM torque.
Subsequent sections will detail various analyses conducted using EMWorks products.
No-Load Analysis
The initial position of the rotor is defined with the north rotor pole axis (d-axis) aligned with the phase AA’ axis. Cogging torque arises from the interaction between the ferromagnetic core and the permanent magnets. Figure 6 illustrates the cogging torque results for the Prius IPMSM, showcasing a sinusoidal pattern with a period of 7.5 degrees (360 degrees/48 slots). At 2.5 degrees, it peaks at 1.79 Nm. Additionally, Figure 7 displays the magnetic flux density distribution at 0 degrees when winding excitation is absent.
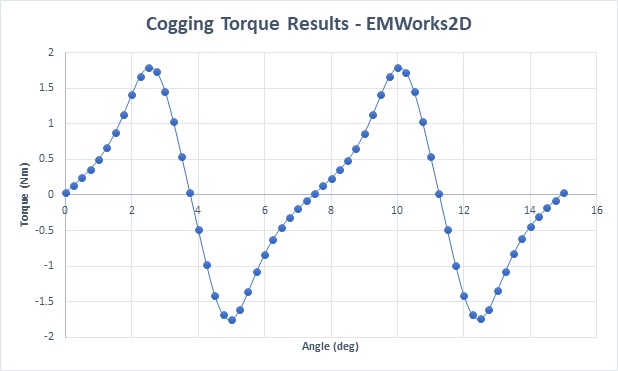
Figure 6 - Cogging torque results
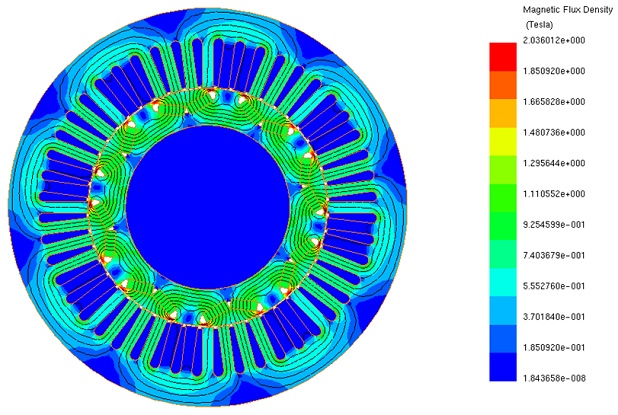
Figure 7 - No-load magnetic flux density
Locked Rotor Analysis
Experimental measurements conducted by various laboratories and documented in [10][11][12] present the locked rotor torque outcomes at varying current levels. Figure 8 juxtaposes the torque results at different current levels obtained from EMWorks2D simulation and experimental measurements. Notably, the peak torque is observed to occur approximately between 60-68 degrees of mechanical angle. Figure 9 further illustrates the relationship between peak torque values and current levels.
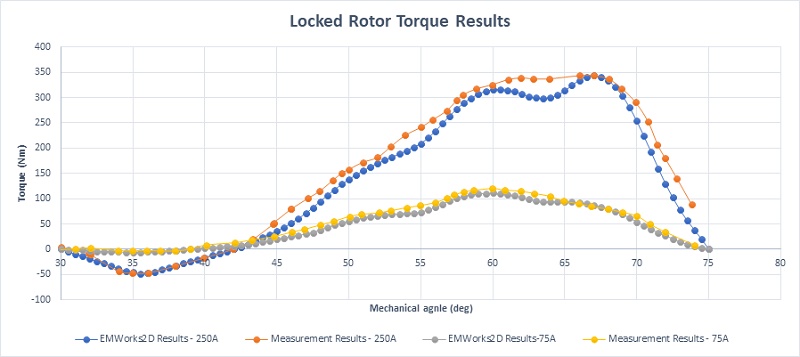
Figure 8 - Locked rotor torque
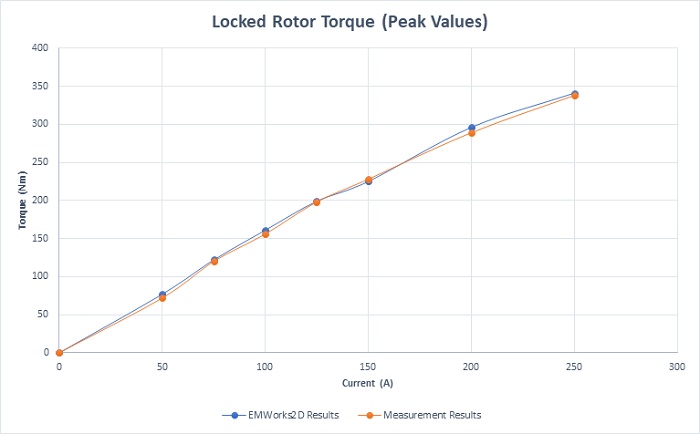
Figure 9 - Motor peak torque values versus the motor current amplitude.
Load Analysis
The PM synchronous machine operates with sine wave excitation (230A RMS, 80Hz) while maintaining a rotor speed of 1200 RPM. In Figure 10, the magnetic flux density distribution at 0 degrees reveals high field concentrations near the rotor magnet bridges. Figure 11 presents an animation depicting the magnetic field behavior. Load torque fluctuations, ranging between 434 Nm and 339 Nm, are depicted in Figure 12.
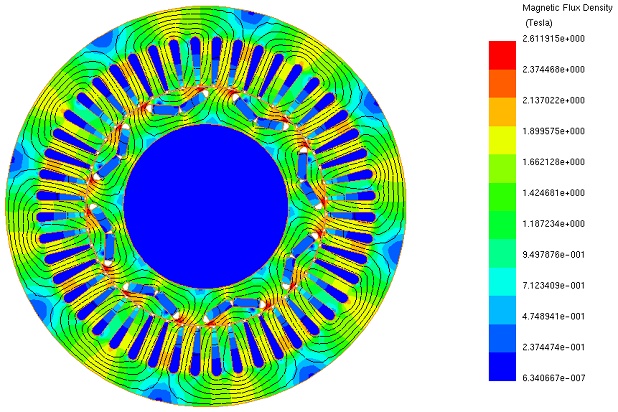
Figure 10 - Flux density distribution at 0 deg – windings are excited
Figure 11- Magnetic field animation
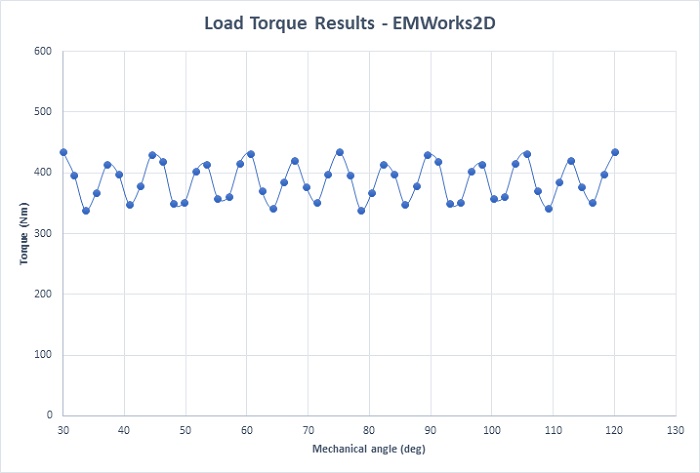
Figure 12- Load torque versus rotor mechanical angle
Electromagnetic simulation software offers a transformative solution for electric vehicle design, optimizing performance and reliability. With this technology, engineers can unlock the full potential of electric vehicles, contributing to a more sustainable future for transportation.

